Grid-aware websites journey via GSoC 2025
Exploring estimations and reductions of websites’ carbon footprint over the summer

I’m excited to share my Google Summer of Code (GSoC) journey this year, where I worked on an exciting project to make Wagtail.org a grid-aware website. The idea behind this project is simple but powerful: websites can reduce their carbon footprint by adapting themselves based on the carbon intensity of the electricity grid in a user’s location.
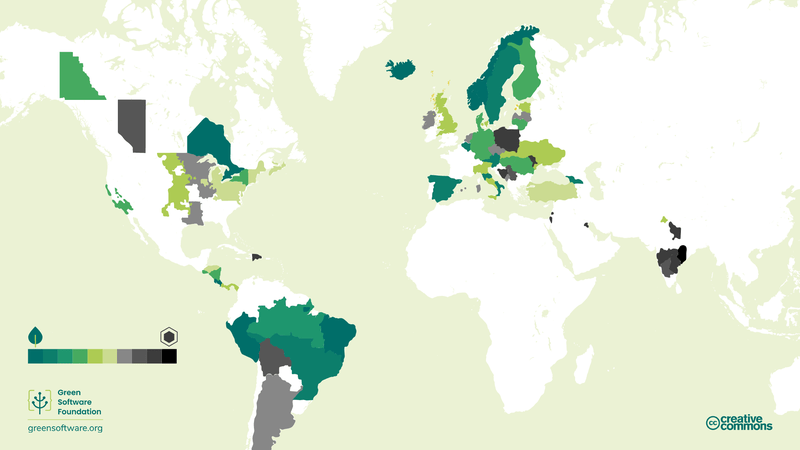
Now, what does carbon intensity actually mean? In simple terms, it’s a measure of how “clean” or “dirty” the electricity is at a given moment. If the local grid is powered mostly by coal or gas, the carbon intensity is high (dirty). If it’s powered mostly by solar, wind, or hydro, the carbon intensity is low (clean). By knowing this, a website can decide to serve a lighter version when the electricity is dirty, and a full-featured version when the electricity is clean. Here is an illustration of how the intensity and available data might vary around the world at any given moment, courtesy of the Green Software Practitioner course:
The case for grid-aware websites
This project is part of a partnership with the Green Web Foundation, and it caught my attention because it felt like a great opportunity to dive deeper into how websites consume energy and explore ways we can make them more sustainable. Grid awareness is one of many options to deliver those sustainability improvements.
The challenge
Over the last two decades, websites have become more complex. The older, simple-looking sites have now transformed into modern websites full of animations, videos, and heavy content. While these look great, they also come with a cost: higher energy consumption.
In some cases, that complexity might be warranted, but we nonetheless want to vastly reduce those sites’ carbon emissions. That’s the challenge we want to tackle:
- If the grid is clean and powered mostly by renewables, then the site can show the full version with all its features.
- But if a user’s electricity grid is running on fossil fuels, the website should adapt by showing a lighter version, removing heavy elements like autoplay videos, large animations, background effects, or any other energy-intense functionality.
But there was a big question my mentors and I had in mind:
👉 How much difference does this actually make?
Would it save enough energy to be worth adding the extra complexity of API calls to retrieve data about the electricity grid, business logic to determine which version of the site to load, and all the adaptive layers?
We decided to take a step back. The plan was to do proper research first, run experiments, and let the data guide our decisions rather than assumptions.
Our approach
To figure this out, we broke our work down into five major steps:
- Testing setup – We used sitespeed.io with the Firefox Profiler to run the analysis. The key metrics we tracked were CPU power, CO₂ emissions, transfer size, and performance score.
- Optimized copies – We created four different versions of the wagtail.org site: one without the homepage video, one without images, one without tracking scripts, and one “best-case” version without all of these elements combined. To save time, we also wrote scripts to automate this process.
- Results generation – We ran tests on all the different versions and documented the results in spreadsheets, including side-by-side comparisons of the differences.
- Carbon emission data – We researched the carbon emissions of Cloudflare Workers, our chosen implementation platform to retrieve grid data and adjust the website’s pages in production.
- Implementation check – Finally, if the results show that the differences are significant enough to reduce emissions, the plan is to implement the Green Web Foundation’s grid-aware toolkit.
Key results
The results we got after the analysis of pageloads were promising. Here’s the highlight of the differences we observed:
- CPU package energy: reduced from 55 mWh to 49.2 mWh (10% lower)
- CO₂ emissions per page load: reduced from 1.76 g to 0.21 g (90% lower)
- Transfer size: reduced from 5,800 KB to 708.9 KB (80% lower)
- Performance score: improved from 70 to 80
At scale, for a hypothetical 1 million page loads, this translates to a reduction of ~1.7 tonnes of CO₂ emissions, alongside noticeably faster performance for users.
Of course, removing everything as in our best-case version isn’t practical. However, even small optimizations can have a big impact. For example, the 30-second homepage video alone accounted for 94% of the site’s bandwidth. Simply replacing it with a placeholder could greatly reduce emissions.
👉 You can check out the full results spreadsheet here and the GitHub repo with all setup and scripts here.
Challenges
We faced two big challenges during this project:
- It’s early days for instrumentation to retrieve energy usage of website. Tools like the Firefox profiler have a number of rough edges and little information on how to interpret the data.
- There’s very little information about the energy use of Cloudflare workers. Although Cloudflare publishes their carbon footprint, they don’t provide any estimates per product or in relation to usage levels of the platform.
Next steps
Taking this to production, once we’ve refined our estimates for Cloudflare workers! Alongside this, we’ll test the impact of grid-aware adjustments on performance and user experience. Once we have results, we plan to integrate the Green Web Foundation’s Grid-Aware Toolkit to wagtail.org. And making sure this gets easier to adopt for other projects in the wider Wagtail / Django / Python community!