Online conference footprint: Wagtail Space 2025
How we calculate the carbon footprint of an online conference

Ever wonder what’s the carbon footprint of an online tech conference like Wagtail Space 2025? We have! Its total footprint is 29kg of CO₂-equivalent greenhouse gas emissions.
For those who pay attention to carbon emissions of different activities, for an event with hundreds of participants, that’s not much at all! We still thought it would be interesting to share the numbers and methodology.
Why we’re publishing this
Across thousands of websites, Wagtail’s carbon footprint is in the thousands of tons of CO2 per year. One single event isn’t going to influence it much. But we want to encourage our industry as a whole to be more considerate, and avoid flying thousands of attendees when there are clear alternatives. We hope those estimates help other event organizers understand the clear trade-offs of different options.
What if: Wagtail Space 2025 in London
To put this "29kg" figure into perspective, if Wagtail Space 2025 had been held in person in London, with 374 attendees over three days we would be looking at:
- 7.8 tons of CO₂-equivalent emissions from hotel stays (2 nights at 10.4 kg per room.night)
- 0.5 tons of emissions from train travel for our UK attendees (0.04 kg per passenger.km)
- North of 100 tons of emissions for flights from international attendees
Orders of magnitude higher emissions than the online event. Those figures are based on well-established 2025 UK government GHG reporting factors.
Methodology: online events footprint
Planning the next Wagtail Space, we expected from the get-go that an online event would have a dramatically lower footprint and be much more compatible with our sustainability commitments for Wagtail.
We followed four rough steps:
- Understand how to model conference activity: as video streaming vs. video conferencing
- Estimate energy use per hour of conference attendance.
- Apply weighted grid carbon intensity: based on attendees’ location
- Putting it all together - combine the above with our attendance statistics!
Find our step-by-step explanations below - 👉️ or check out the resulting Online conferences footprint calculator in Google Sheets.
Comparable activities
We had good reason to expect a comparable footprint with video streaming or conferencing, but weren’t sure which of the two would be best considering our circumstances:
- We ran our event on the Zoom Events platform, where attendee experience is very similar to joining a series of meetings on Zoom.
- For the bulk of the presentations, the content consisted of one 720p video feed + audio.
Looking at our conference schedule, 91% of the experience was this kind of "one-way video streaming" from a speaker to participants, with the remaining 9% being meeting-style multi-way streaming. For the sake of simplicity, we chose to reuse video streaming information to model our footprint.
The energy consumption of video streaming
We decided to reuse the data compiled in a literature review done by the European Commission: Assessment of the energy footprint of digital actions and services (2023). It summarizes a lot of the available data and provides strong references.
Here’s the most important data from the report for our purposes, summarizing electricity consumption of 1h of video streaming across three scenarios:
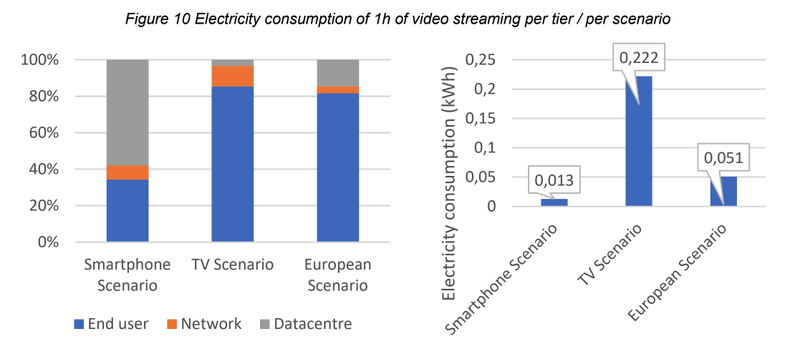
On the left, we can see where energy use happens between users’ devices, the network, and data centers - across video streaming on smartphones, TVs, and a "European scenario" representative of devices in Europe.
On the right, we see absolute energy consumption per scenario:
- 0.013 kWh for smartphone streaming
- 0.222 kWh for TV streaming
- 0.051 kWh for the European scenario (70% smartphone + tablet usage, 15% TV, 15% desktop / laptop)
The user’s device is actually one of the biggest factors for the energy use of video streaming. Quoting another report, Carbon impact of video streaming from the Carbon Trust: the footprint of watching on a 50-inch TV is roughly 4.5 times that of watching on a laptop, and roughly 90 times that of watching on a smart phone. 90 times! So it‘s critical we estimate what devices our audience might be using.
Combining those figures with our Zoom analytics, we arrived at:
- 169 (10.35%) session attendance records via "mobile", with energy use of 0.013 kWh per hour.
- 1464 (89.65%) session attendance records via "desktop", using up 0.076 kWh.
For further calculations, we could proceed with a weighed average of 0.070 kWh per hour of streaming of our conference.
Grid carbon intensity for attendees
From the literature review and the Carbon Trust’s report, it’s clear that attendees’ devices are where the majority of the energy use happens. So next, it felt natural to combine our energy use figures with country-specific grid carbon intensity data from Ember. Looking at the location data from Zoom analytics, our attendees joined from:
- 🇺🇸 United States of America: 20%
- 🇬🇧 United Kingdom: 17%
- 🇳🇱 Netherlands: 4%
- 🇨🇴 Colombia: 4%
- 🇫🇷 France: 3%
- 🇮🇳 India: 3%
- 🇩🇪 Germany: 3%
- 🇨🇦 Canada: 2%
- 🇳🇬 Nigeria: 2%
- 🇵🇹 Portugal: 1%
- 🌍️ World: 41% (all other countries below top 10)
Across the world, the grid carbon intensity differs widely:
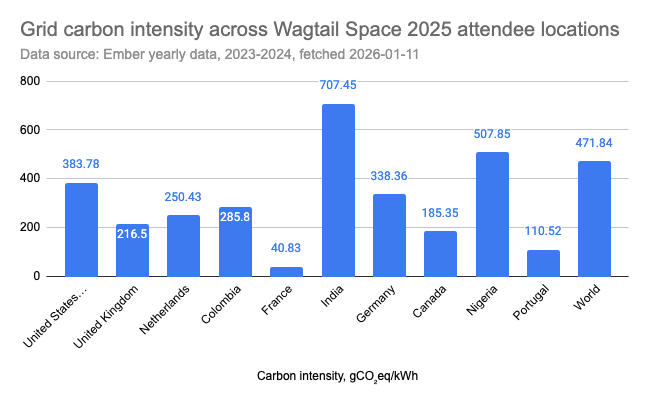
Just like with device types, we arrived at a weighed average of those locations’ grid carbon intensities: 375.61 gCO₂eq/kWh. That’s an oversimplification as Zoom data centers aren’t in the same location as our attendees, but felt like the right trade-off nonetheless.
Putting it all together
We now know:
- The energy use of 1h of Wagtail Space streaming: 0.070 kWh.
- The carbon intensity: 375.61 gCO2e/kWh
- Combining the two, we get a figure of 26.21 grams of greenhouse gas emissions per hour.
Combine that with 1099 person-hours of attendance during our conference, we arrive at 29kg of CO2-equivalent emissions.
What’s not included
For clarity, the above methodology is full of assumptions. In particular, it ignores:
- Any of the specifics of Zoom’s backend infrastructure. We confirmed the stream resolution at 720p and that’s about it.
- Embodied emissions of devices. We’re only looking at emissions from usage.
- Any attendance scenarios beyond "smartphone/tablet" vs. "desktop/laptop". No accounting for TV viewing, or watch party situations with multiple viewers.
- The footprint of tasks done by organizers and speakers before and after the event.
- The conference website and Zoom event space outside of sessions.
- Rebound effects (if people don’t travel to attend the event, what do they do instead, and does that create emissions elsewhere?)
What’s next
Definitely expect another flagship Wagtail Space event online in the future! In the meantime, we’re preparing for our next event in early February: What’s New in Wagtail webinar (Feb 10th at 17:00 UTC, 11th at 10:00 UTC).
On the carbon footprint front, we will be looking at other aspects of our project - such as continuous integration.
Oh and – if you haven’t already, check out our recordings from Wagtail Space 2025!
- State of Wagtail 2025
- Wagtail in industry: from farming to finance
- Redesigning and refactoring Wagtail components
- Building Better Wagtail Sites: Traits of a Good CMS
- REX: Building a SaaS from Wagtail
- Implement the French Government Design System in Wagtail
- Wagtail Nest: Maintaining Community Packages Together
- Automated Data Loader: Wagtail for Weather Data Integration
- Building Flexible Wagtail CMS Experiences for Editors
- Building a little YouTube on Wagtail
- Creating connections between stories and objects using AI
- AI in Wagtail: responsible innovation for content editors
- The Bogotá Digital Library: A Wagtail Success Story
- Wagtail and AI Agentic Coding
- The Impact of A Contribution to Wagtail
- One URL to Rule Them All: Dynamic Landing Pages in Wagtail
- Fact checking with Wagtail
- Sympa newsletters with Wagtail
- Code that creates content
- Who's that code snippet? A screen reader guessing game
- Bird Meets Bot: Using AI Tools to Make Wagtail Smarter
- Where next for Wagtail Search?