uv overtakes pip in CI
An opportunity for more opinionated defaults

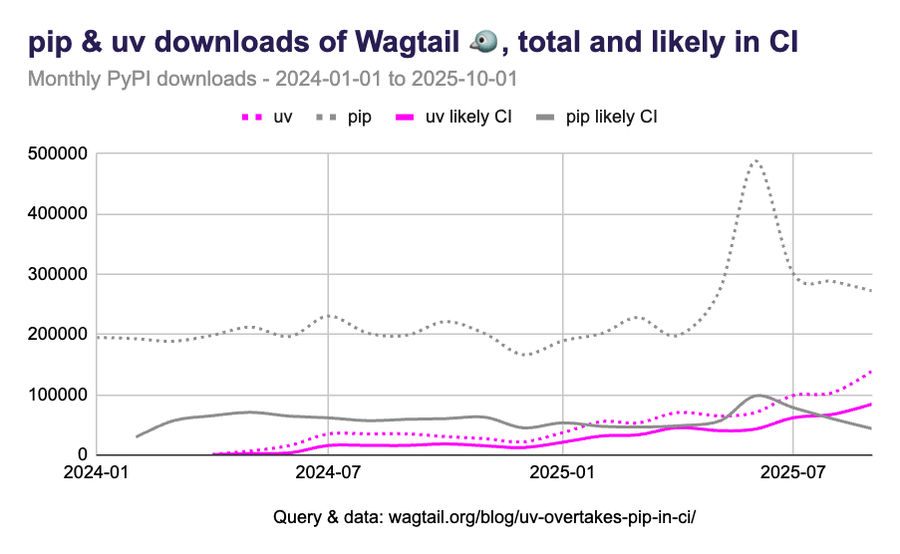
^ in CI for Wagtail projects, uv now sees more usage than any other installer. It’s at 66% of CI downloads of Wagtail, compared to 34% for pip. Other installers don’t report their CI usage specifically, but their overall usage is very distant.
What it means for Wagtail
"uv = good" is old news for all of the early adopters. For us, we look at those kinds of usage trends on a regular basis to figure out where everyone else is at. It’s a big deal if uv becomes the majority tool. And looks like it is now, at least in CI. In practice, it means it might be time for us to revisit our README install steps, tutorial / workshop instructions, or even the built-in project template – do we reflect the lower common denominator experience with pip, or the majority (and often superior) experience with uv?
In other projects
Oh and it’s not just looking to be that way for Wagtail, here are the same numbers for Django:
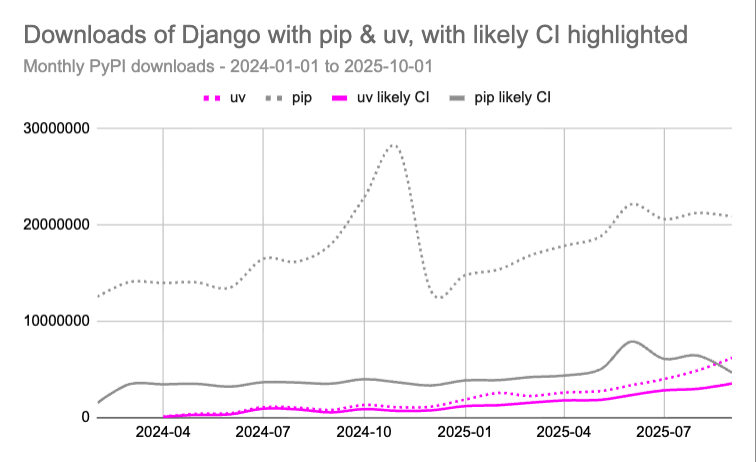
Looks like it’s the same story, just shifted by a few months? uv represents 21% of total Django downloads, and 43% of CI downloads.
And for good measure, the same numbers for FastAPI:
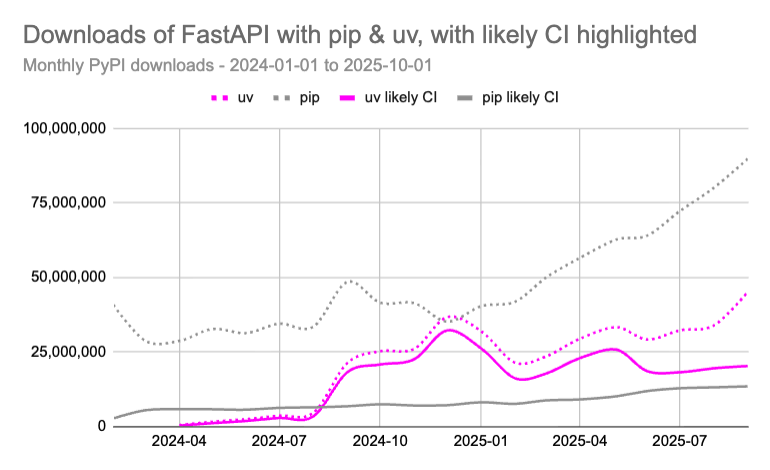
Similar story, though again shifted by a few months? uv represents 31% of total downloads, 60% of CI downloads.
Methodology notes
Back to Wagtail, here are the download numbers and proportions for September 2025:
- 480k total Wagtail downloads
- 55% via pip (272k)
- 28% via uv (139k)
- 128k total downloads in CI (26%), with:
- 34% for pip (43k downloads, 16% of total pip downloads, 9% of total)
- 66% for uv (85k downloads, 61% of total uv downloads, 17% of total)
There is a fair chance the data will shift a bit month to month, but the trend is pretty clear (see the data and query if you want to dive deeper). For people unfamiliar with PyPI download statistics in BigQuery, this is what is possible to do:
WITH filtered_downloads AS (
  SELECT
    timestamp,
    details.installer.name AS installer,
    details.ci AS ci
  FROM `bigquery-public-data.pypi.file_downloads`
  WHERE project = 'wagtail'
  AND timestamp BETWEEN TIMESTAMP('2024-01-01T00:00:01.000Z') AND CURRENT_TIMESTAMP()
)
SELECT
  TIMESTAMP_TRUNC(timestamp, MONTH) AS month,
  installer,
  ci,
  COUNT(*) AS num_downloads
FROM filtered_downloads
GROUP BY month, installer, ci
ORDER BY month, num_downloads DESC, ci;
This is all shared with the caveats that not all downloads are equal, some installers might produce more or fewer downloads than others in some conditions (depending on caching implementation details). And the proportion of "CI" within those download statistics is more of a lower end of likely real figures. It’s unclear how comparable "% downloads via uv in CI" and "% downloads via pip in CI" are. Still though, if overall uv download figures go 4x over a year, we take note.
If you want to learn more about download statistics, check out PyPI downloads statistics and continuous integration on the Python forum.