The carbon footprint of Wagtail AI
Measuring the energy and emissions of everyday AI tasks in Wagtail

Ever wonder what is the energy use or carbon footprint of your AI adoption? We certainly have, just like we measure the environmental impact of Wagtail websites. With so many Wagtail projects out there, small design decisions have a tremendous impact when compounding over thousands of websites, millions of pages, billions of pageviews.
AI’s carbon footprint is simple to measure, because it’s directly tied to the energy use of the models. The gold standard in that space has been Mistral’s Our contribution to a global environmental standard for AI, where they share the combined environmental impact of training and usage of their Large 2 model:
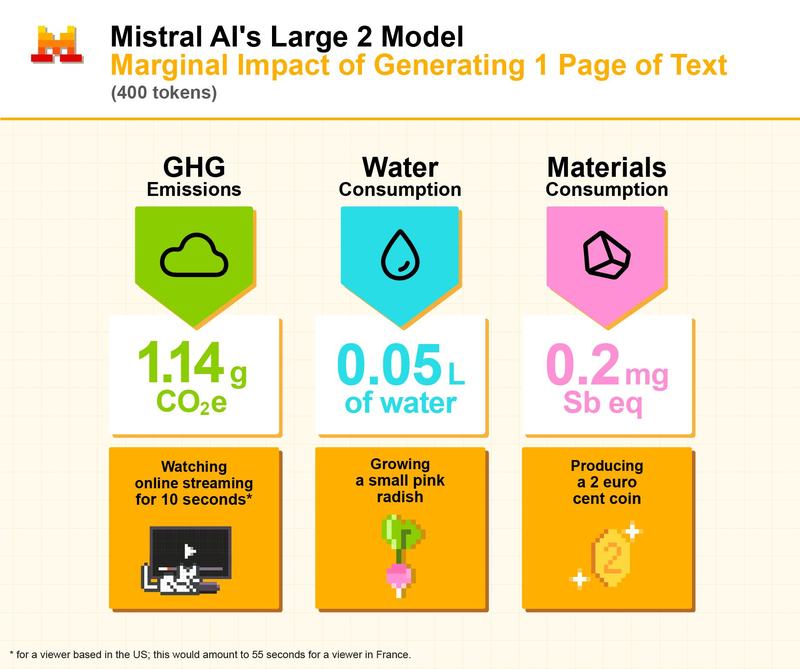
This kind of life cycle assessment is the gold standard in our industry, and we should be expecting similar information from all vendors.
Wagtail AI tasks
Trying to replicate this degree of transparency for our Wagtail AI package’s footprint, here are our results:
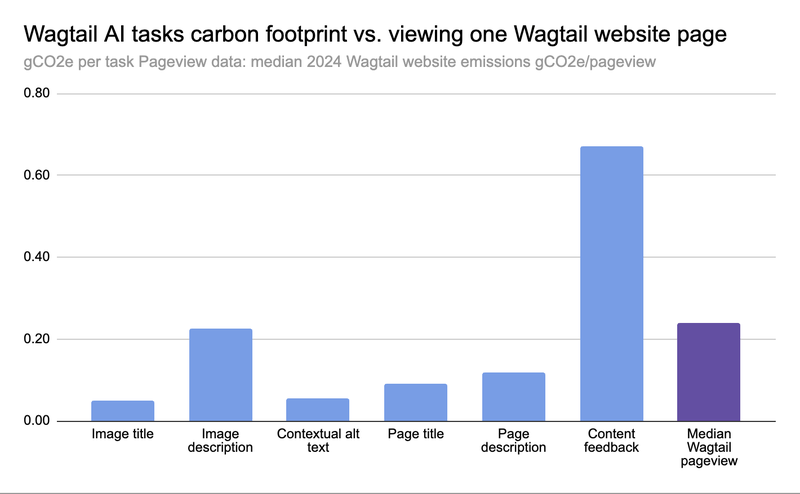
The exact numbers are:
- 0.05 gCO2e (grams of CO2 equivalent) when generating an image title
- 0.23 gCO2e for image description / alt text
- 0.09 gCO2e for page titles, 0.12 for descriptions
- 0.67 gCO2e when generating qualitative content feedback
We can compare those figures with the median footprint of loading a Wagtail website page in 2024, 0.24 gCO2e (better than the 0.36g industry-average, SWDM v4 methodology).
As far as digital carbon footprint, those are tiny amounts per task. What matters is how the per-task footprint scales across such a large ecosystem. Making sure we design our integrations with a responsible approach.
Year over year, large language models are getting better at efficiently processing the kind of data needed to accomplish those tasks, and we are already an order of magnitude lower than reported in the 2024 AI index report:
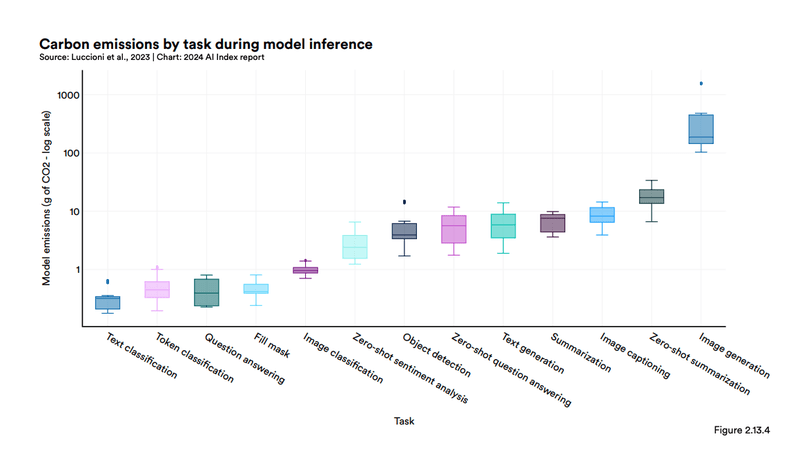
For Wagtail AI, this isn’t just a matter of more efficient models. We make sure Wagtail users and site implementers are in control of where and how much AI is used. We design our integrations very carefully, and actively avoid problem tasks like image generation.
Methodology
Those results are very simple to replicate for your own AI adoption. The energy measurement is trivial to do with Neuralwatt, who compute the energy use of every AI query. We can then "world" carbon intensity data from Ember (471.84 gCO2e/kWh) to extrapolate carbon emissions. We used Kimi K2.5 for our measurements, a flagship open weights model (MoE, 1000B parameters, 32B active). We measured with the contents of the Wagtail user guide (see our prompts). The content of the site is copyright-free (CC0 public domain), feel free to reuse it for your experiments.
What next
For Wagtail, we will next measure the footprint of the most common developer tasks emerging from our AI and Developer Experience survey (please take the survey if you haven’t yet!), and share more of our estimates at the What’s New in Wagtail in May.