Wagtail’s 2025 carbon footprint
Measuring Wagtail websites’ footprint so we can reduce it

Two years on from our first attempt at estimating Wagtail websites' emissions, this is our third annual report on the Wagtail ecosystem's footprint. This 2025 report tells a more complicated story than the last two.
Our footprint in one number
5,173 tons of CO2-equivalent emissions per year for 2025, across 6,431 Wagtail sites in our dataset. That's an 18% decrease from 2024’s 6,327 tons, for 4,889 sites.
On the face of it, good news. But the reduction doesn’t seem to be correlated with sites becoming more efficient. The per-site picture is mixed at best, and most of the drop comes from a methodology-sensitive variable (our estimated page views) swinging hard. We'll walk through what the numbers actually say. But if you want the high-level picture, this is where we’re at year-over-year:
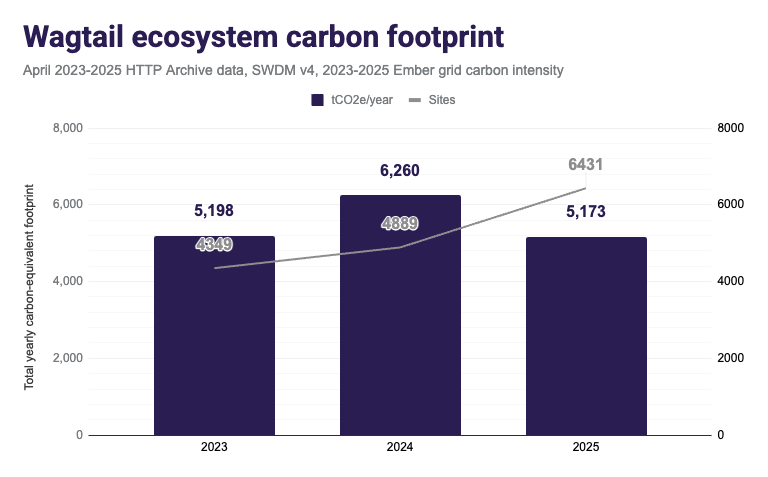
- 2023: 5,198 tCO2e for 4,349 sites
- 2024: 6,260 tCO2e for 4,889 sites
- 2025: 5,173 tCO2e for 6,431 sites
Approximately flat in total, while the number of websites has grown by ~50%. The ecosystem is absorbing growth without proportional emissions growth (great!), but we want a 10% per year downward trend that holds over decades if we wanted to be on pace with Net Zero goals.
What actually changed
Two numbers tell most of the story. First, page weight: the median homepage weight rose 12%, from 2,589 kb to 2,905 kb. Sites got heavier. This is the variable we have the most direct measurements for, and it's moving in the wrong direction.
We can visualize it over time with our use of Digital Carbon Ratings, which show us how the scores of Wagtail websites are distributed over time:
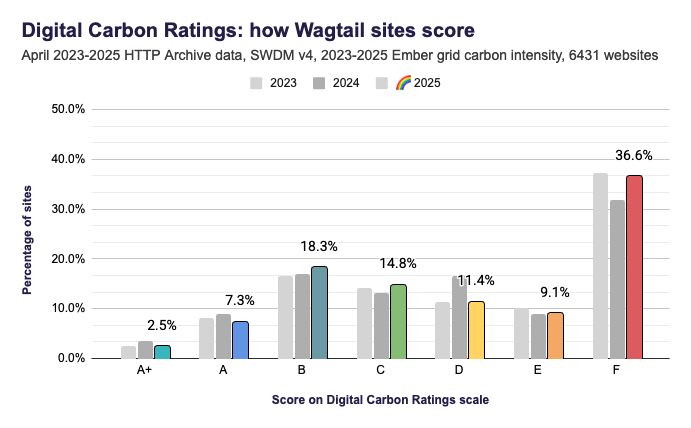
We also like this variable because it’s one we can control to some degree. For example, Wagtail 7.3 shipped with 40% smaller images, at the same quality. We expect that kind of improvement will show up in the 2026 data, as websites adopt the new releases.
Lower page views
The other number that tells a story is page views. Total estimated pageviews dropped 38%, from 15.5B to 9.6B. This is the variable doing nearly all the work behind the −18% headline figure on total 2025 emissions. Our pageview estimates come from extrapolating CrUX rankings to traffic figures. A 38% year-over-year shift across the dataset is very large, and likely reflects both methodological shortcomings (more analytics blockers, data issues) and a real ecosystem-wide traffic decrease. For example, in our source pageview dataset, we can clearly observe a rapid increase in AI referrals over time, which represents a clear increase in usage of AI tools to find information:
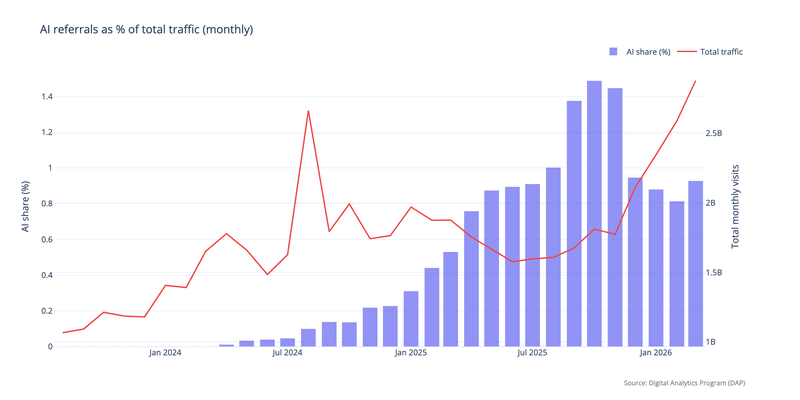
There is very limited data out there at the scale of our ecosystem, so we’ll need to be careful in the future in how we conduct similar ecosystem-wide assessments.
Other factors of site footprint
Additionally to those page weight and page views factors, there are other opportunities we could use to better understand the websites’ live footprint. Here are three we’re particularly interested in:
- carbon.txt, as a new proposed format for organizations to share their digital footprint information. This would give us the opportunity to swap from high-level estimations to more precise ones, for organizations publishing in that format.
- This can be complemented with the Technology Carbon Standard, as explained on the Green Web Foundation blog.
- We could also report differently when sites are confirmed to use green hosting, with the Green Web Check - so we use more correct carbon intensity data.
In our 2025 dataset, 48% of websites are served by green energy providers. That’s a big opportunity to improve the correctness of our estimates, and also to encourage more sustainable infrastructure choices.
Ecosystem footprint beyond page views
The site-level emissions estimate is one piece of the picture. We've been measuring and acting on a few other things last year:
- The carbon footprint of Wagtail AI: we measured the per-task emissions of common operations in our Wagtail AI package, comparing them with median page-load emissions. Per-task footprints are tiny in absolute terms, but matter at scale across the ecosystem. We might add this to our ecosystem-wide footprint figures in the future, if we can devise a methodology to estimate AI use across Wagtail websites.
- Online conference footprint: Wagtail Space 2025: we measured our online conference at 29kg of CO2-equivalent total, compared to ~7.8 tons if the same event had been held in person in London. A useful concrete data point on the trade-offs of event formats.
We’ll keep measuring different aspects of our ecosystem, and working on concrete reductions - trying to find where the biggest impacts are possible. This is particularly crucial with increased levels of AI adoption, so we understand the impact of this new paradigm. For example when it comes to agentic engineering on Wagtail / Django projects.
Methodology details
Same methodology as our 2024 report: Sustainable Web Design Model v4, HTTP Archive dataset, country-specific Ember grid carbon intensity factors, CrUX-derived pageview estimates.
For 2025 specifically:
- 6,431 sites from the HTTP Archive dataset (still a subset of all Wagtail sites - we estimate the true population at well over 20,000)
- April 2025 page weight data
- 2025 Ember grid carbon intensity figures where available, with worldwide fallback for sites without a country-specific domain. 2025 "World" intensity: 458.29 gCO2e/kWh
Where next
We’ll be presenting some of this work at our upcoming What’s New in Wagtail webinar in May! Expect more on carbon.txt, and more on the carbon footprint of AI in particular.